Your App Is Slow and You're Losing Users: A Practical Performance Audit Checklist


A client messaged us on a Tuesday morning with one line: "People are signing up and then never coming back." Their product was good. Their onboarding was clear. Their app took eleven seconds to show anything useful on a mid-range Android phone over a normal mobile connection.
They did not have a retention problem. They had a speed problem wearing a retention costume.
This is the part most teams get wrong: they start guessing. Someone says the database is slow, someone else blames React, and three weeks disappear into a rewrite that changes nothing. A proper app performance audit works the other way around. You measure first, you find the one or two things that actually dominate, and you fix those.
Here is the checklist we use, in the order we use it.
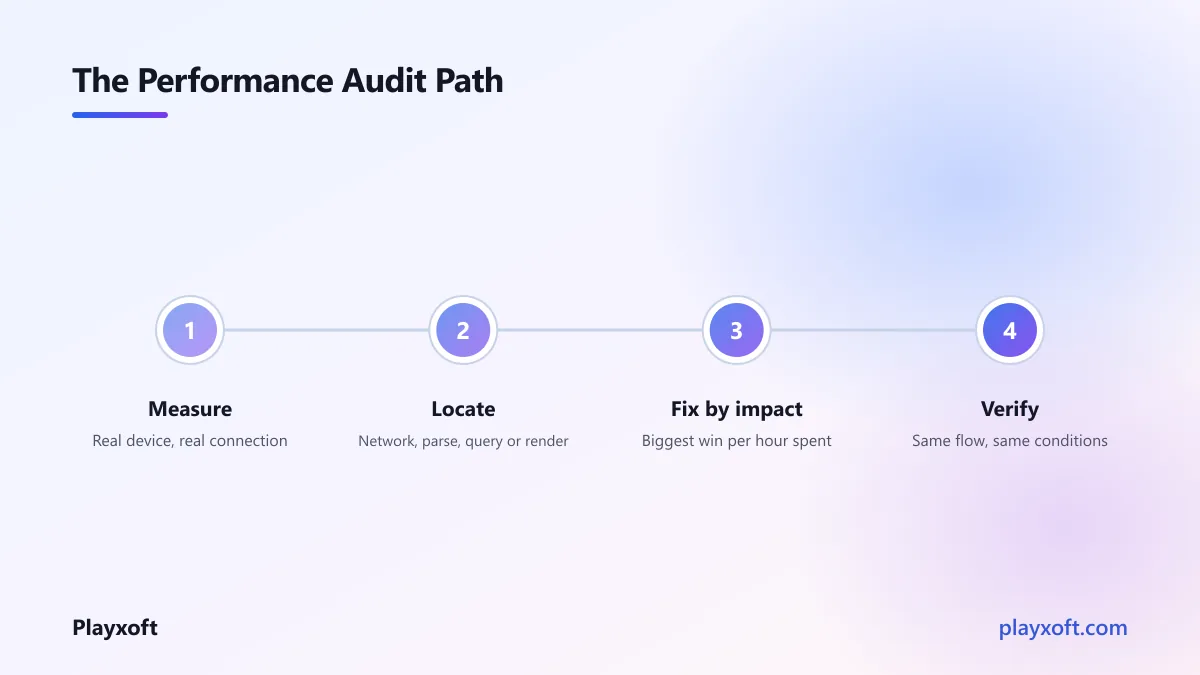
Measure before you touch a single line
The first rule of any app performance audit is that your intuition is wrong. Not sometimes — reliably. Engineers are fast at guessing and bad at it, because we all develop on good laptops with fast connections and warm caches.
So before you optimise anything, get three numbers.
What a real user experiences. Open your app on a throttled connection and a mid-tier device. Chrome DevTools can simulate both. If you build for the web, pull your field data from the Chrome User Experience Report, which records what actual visitors got, not what your laptop got.
Where the time goes on the client. Record a performance trace during your slowest flow. You are looking for one thing: is the wait spent downloading, parsing, waiting on the network, or rendering? Those four have completely different fixes.
Where the time goes on the server. Every request should log its total duration and, ideally, the time spent in the database. Without this you are blind to the most common cause of slowness in a growing product.
Write the three numbers down. You will need them later to prove the work was worth doing.
The seven things that are almost always the problem
Across the products we have worked on, slow apps are rarely slow for exotic reasons. They are slow for the same handful of reasons, over and over.
1. The payload is too big
The single most common cause. Your JavaScript bundle grew a little with every feature, nobody ever removed anything, and now it is several megabytes that must be downloaded and parsed before the screen does anything.
Run your bundler's analyser. You are looking for the big blocks: a date library that ships every locale, an icon set where you use nine icons, a charting library loaded on every page but used on one.
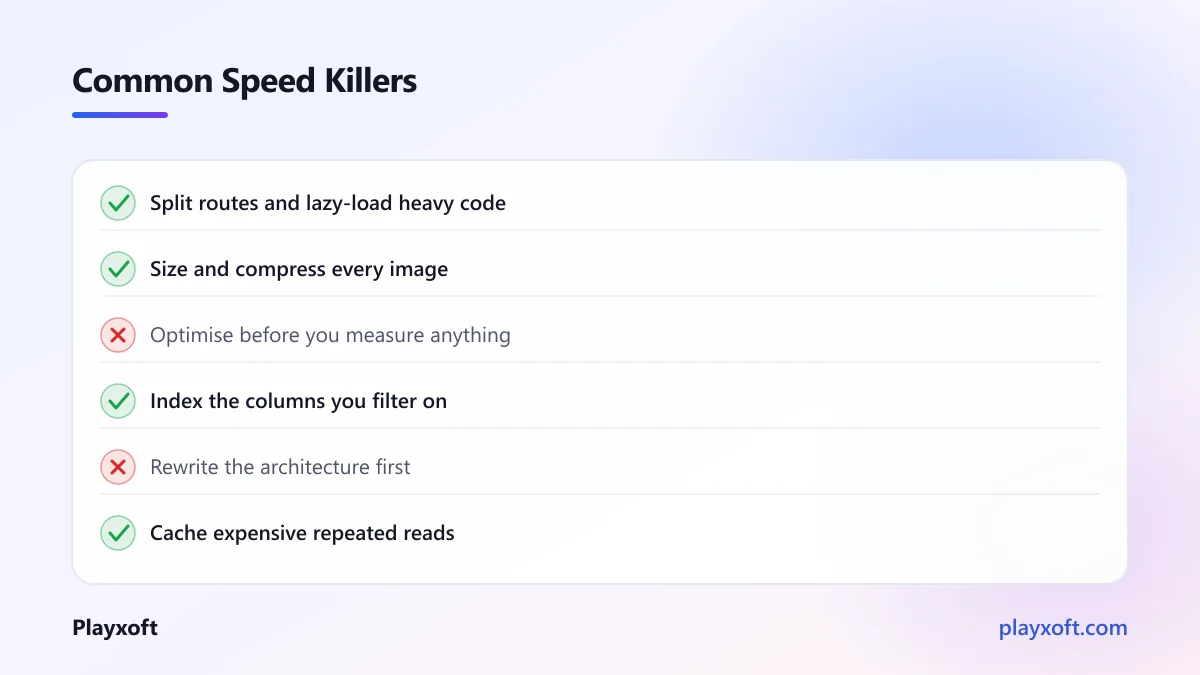
The fixes, in order of payoff: split routes so each page loads only its own code, lazy-load anything below the fold or behind an interaction, and replace heavyweight dependencies with focused ones.
2. Images are doing the damage
Images are usually the heaviest thing on a page and the easiest to fix. Serve modern formats, size them to the space they actually occupy rather than shipping a 4000px original into a 400px slot, and let anything below the fold load lazily.
This one is worth checking even if you think you handled it. We have audited plenty of products where a single un-resized hero image outweighed the entire JavaScript bundle.
3. N+1 queries
Your list endpoint loads fifty records. For each record, your ORM quietly fires another query to fetch a related row. That is fifty-one queries where two would do.
This is invisible in development, where you have twelve rows and a local database. In production, with real data volume and real network latency between the app and the database, it is the difference between 40 milliseconds and 4 seconds.
Turn on query logging in a staging environment, load a realistic page, and count. If one page request produces dozens of queries, you found your bottleneck.
4. Missing indexes
Every query that filters or sorts on a column should have an index supporting it. Run EXPLAIN on your slowest queries — if you see a sequential scan over a large table, you have your answer.
The caveat worth knowing: indexes make reads faster and writes slower, and each one costs storage. Index the columns you actually filter on, not every column.
5. Cold starts
If you deploy to a serverless platform, some share of your users are paying for the platform to boot your code before it can answer them. Big dependency trees make this worse.
Measure the gap between a warm request and a cold one. If it is large, trim the dependencies loaded at module scope, or move the latency-sensitive paths to something that stays warm.
6. No caching anywhere
Most apps re-compute the same answers constantly. A dashboard that recalculates identical aggregates on every page load is doing expensive work for no reason.
Cache at the layer that costs the most: query results for expensive reads, rendered fragments for pages that rarely change, and static assets at the edge with long cache lifetimes and content hashes in filenames.
7. Waterfalls
Three requests that each take 200 milliseconds take 600 milliseconds in sequence and 200 in parallel. Look at your network panel — if you see a staircase pattern, you have dependent requests that could be concurrent, or data that could have been fetched on the server in one round trip.
If this list is uncomfortably familiar
Most teams know roughly what is wrong. What they lack is a free week and someone who has done this enough times to know which of the seven actually matters for their product.
That is a normal position to be in, and it is fixable. If you would rather not spend a month finding out, we can run the audit with you — measurement, findings, and a ranked fix list you can hand straight to your team.
Fix in order of impact, not interest
Once you have your findings, resist the urge to start with the most intellectually satisfying problem. Rank by impact divided by effort.
Deleting an unused dependency takes ten minutes and might remove a third of your bundle. Rewriting your state management is a month and usually changes nothing a user can perceive. Do the first one.
A practical order for most products:
- Remove or lazy-load the heaviest unused code
- Fix image sizing and formats
- Add the missing database indexes
- Eliminate the N+1 queries on your busiest endpoints
- Add caching to your most expensive repeated reads
- Parallelise the request waterfalls
- Only then consider architectural changes
Verify, or it did not happen
Re-run the same measurements from step one, on the same device profile and connection, on the same flow. Compare to the numbers you wrote down.
Two things make this worth the discipline. First, optimisations sometimes make things worse — a cache with a bad invalidation rule can serve stale data and cost you more in bug reports than it saved in milliseconds. Second, an unmeasured improvement is impossible to defend when someone asks why a sprint went into performance work.
If you build for the web, Google's guidance on Core Web Vitals is a reasonable target to hold yourself to, because those are the thresholds real users notice and search ranking reflects.
What a good app performance audit actually produces
If you hire someone to do this, or do it yourself, the output should be four things. Anything less is a conversation, not an audit.
A baseline. The three numbers from step one, captured under conditions you can reproduce. Without this, nothing that follows can be proven.
A ranked list of causes, with evidence. Not "the database is slow" but "this endpoint fires 63 queries per request, here is the trace, here is the query that repeats." Each finding should point at something specific enough to fix on a Monday morning.
An effort estimate per fix. Ten minutes, half a day, or a sprint. This is what lets a product owner decide what goes into the next cycle instead of deferring the whole thing indefinitely.
An explicit do-not-do list. The things that look slow but are not worth touching, and why. This is the part clients tell us they value most, because it gives them permission to stop worrying about something an earlier consultant flagged.
We usually deliver this as a short document plus a recorded walkthrough, because performance findings are far easier to follow when someone talks you through the trace.
Keep it from coming back
Performance is not a project you finish. It decays, quietly, with every feature.
Three habits keep it from rotting:
Set a budget. Pick a maximum bundle size and a maximum response time for your key endpoints. Write them down.
Enforce it automatically. Add a check to your build that fails when the budget is exceeded. A number in a document gets ignored; a failing build does not.
Watch production, not staging. Real users on real devices are the only measurement that counts. Sample your actual response times and page loads, and alert when they drift.
Speed is a feature your users feel before they can name it
Nobody writes a review saying "the sixth-percentile interaction latency was excellent." They just say the app feels good, and they stay. The reverse is also true: they will not tell you it was slow, they will simply stop opening it.
An honest app performance audit usually takes a few days and finds two or three things responsible for most of the pain. That is a much better trade than a rewrite, and it is work you can do without disrupting your roadmap.
If your product feels slower than it should and you want a clear, measured answer rather than a guess, book a free consultation call or email us at info@playxoft.com. We will tell you what is actually slow, what it will take to fix, and what we would leave alone.