Core Web Vitals in 2026: The Speed Fixes That Actually Move Revenue

Most teams meet Core Web Vitals the same way: a report lands in someone's inbox, it is mostly red, and a meeting happens where nobody is quite sure what "Interaction to Next Paint" means or whether it is worth a sprint.
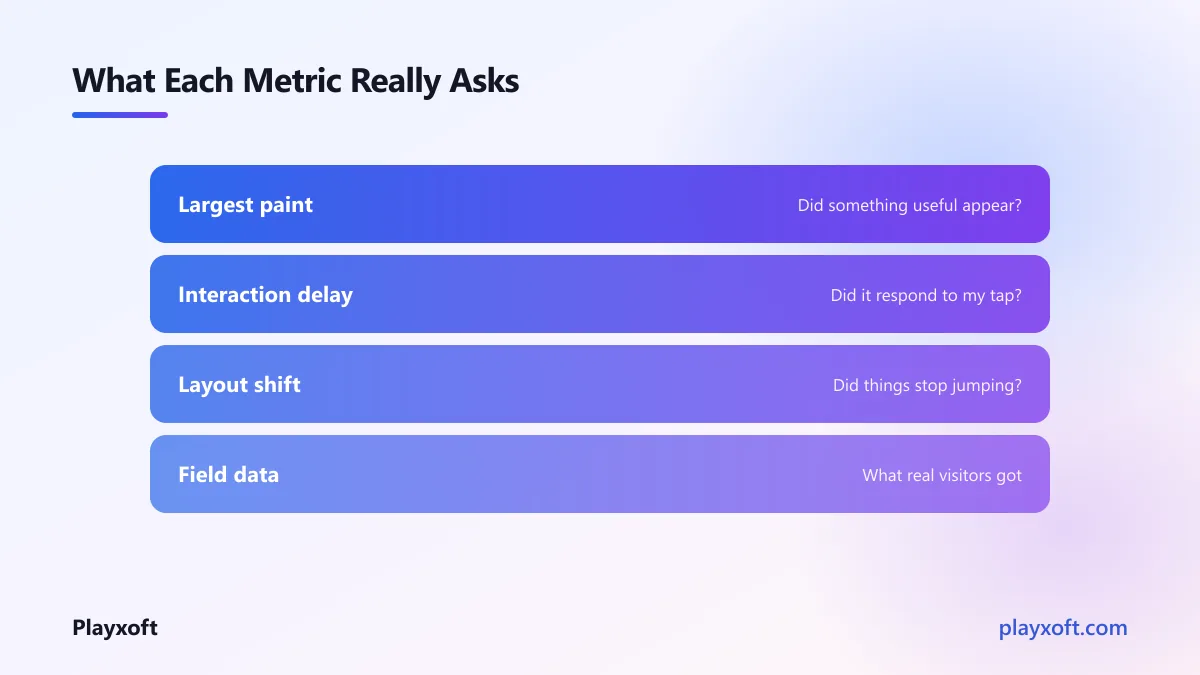
So let us start by removing the mystery. Core Web Vitals in 2026 are three numbers, each measuring one honest question a visitor would ask without knowing they were asking it.
- Did something useful appear quickly? That is LCP.
- Did the page respond when I tapped? That is INP.
- Did things stop jumping around? That is CLS.
That is the whole concept. Everything else is implementation detail.
What the three numbers actually measure
Largest Contentful Paint times how long until the biggest thing on screen — usually your hero image or headline block — finishes rendering. It is a proxy for "the page looks ready." Google's published threshold for a good score is 2.5 seconds, measured at the 75th percentile of your real visitors.
Interaction to Next Paint replaced the old First Input Delay metric, and it is a much harder test. FID only measured the delay before your code started responding to the first tap. INP measures the full round trip — tap, processing, and the screen actually updating — across the whole visit, and reports close to your worst interaction. A site can pass the old metric comfortably and fail this one badly.
Cumulative Layout Shift measures how much content moved around unexpectedly while loading. This is the metric behind the universal experience of reaching for a button and hitting an ad because something loaded above it.
For the current thresholds and how each is calculated, Google's own documentation on Core Web Vitals is the source worth reading rather than any summary, including this one.
What changed in Core Web Vitals heading into 2026
Two shifts are worth knowing if your mental model was formed a few years ago.
Responsiveness got a much stricter test. The move from First Input Delay to Interaction to Next Paint is the single biggest change, and it caught a lot of sites out. The old metric was forgiving: it measured only the delay before your code began handling the first interaction, and most sites passed it by default. The new one measures the entire interaction, every interaction, and reports near your worst. Sites that had a green responsiveness score for years suddenly did not.
The practical consequence: heavy JavaScript that used to hide behind a friendly metric is now exposed. If your page does a lot of work on the main thread after load, you will see it here.
The bar for images moved. Modern formats and explicit dimensions went from good practice to effectively assumed. A page shipping oversized images in dated formats is now competing against sites where that is solved by default in their framework.
Neither change altered the underlying goal, which has been constant: measure what the visitor experiences rather than what the server does.
Measure the right thing, or you will fix the wrong thing
This trips up nearly everyone, so it is worth being precise.
Lab data comes from tools that load your page in a controlled environment. It is repeatable, available instantly, and useful for debugging. It is also not what your ranking or your users reflect.
Field data comes from real visits by real people on their real devices and connections. It is what Google actually uses, and it is collected over a rolling window, which means a fix you ship today shows up in the numbers weeks later.
Practically: use lab tools to find and verify fixes, and field data to decide whether there is a problem at all. A page that looks terrible in a lab test but has healthy field data is probably fine — your real visitors may be on better hardware than the simulated device. The reverse is far more urgent.
If you have meaningful traffic, the Chrome User Experience Report gives you field data without installing anything.
The fixes that move LCP
LCP problems are almost always one of four things, in this order of frequency.
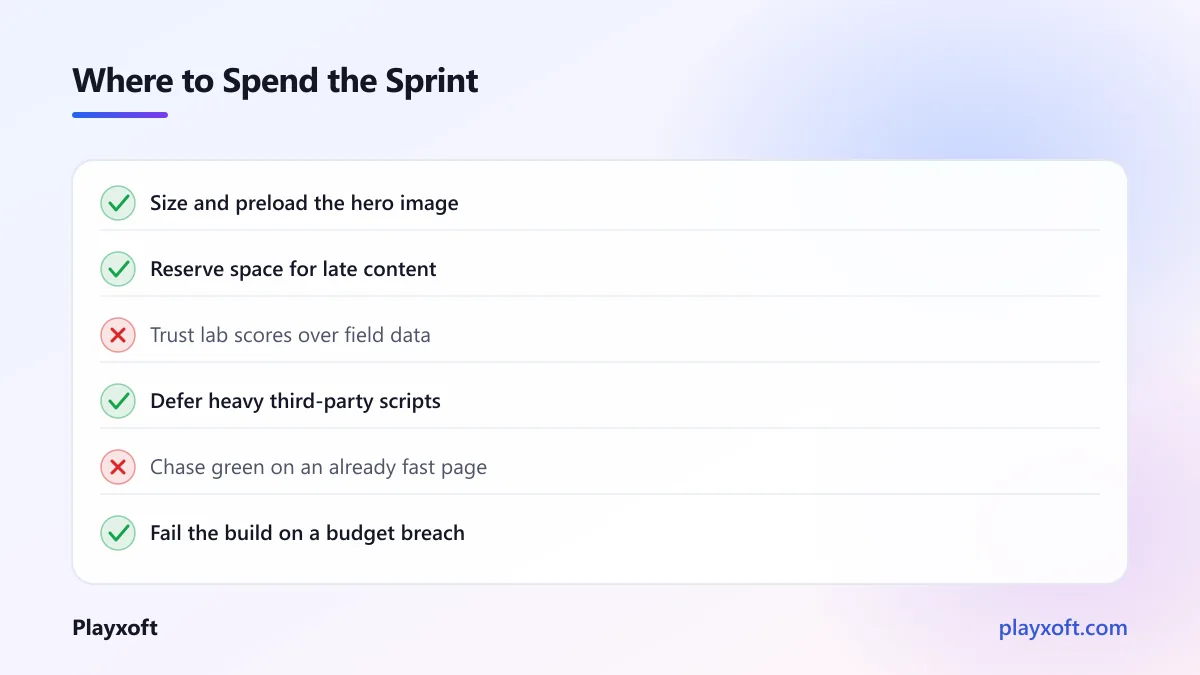
Your hero image is too heavy. Serve it in a modern format, size it to the space it actually occupies rather than shipping the original, and give it explicit width and height so the browser can reserve space. This one fix resolves more LCP failures than everything else combined.
The browser discovers it too late. If your hero image is loaded by JavaScript, or sits behind a chain of CSS imports, the browser cannot start fetching it until late. Preload it, or better, put it in the initial HTML.
Render-blocking resources. Every stylesheet and synchronous script in your head delays the first paint. Inline the small amount of CSS needed for what is visible immediately, and defer the rest.
Slow server response. If your server takes a second to return the first byte, no front-end work will save you. Cache what you can at the edge, and look at what the server does before responding.
The fixes that move INP
INP is about the main thread. Everything your page does — running scripts, rendering, responding to taps — competes for one thread, and when it is busy, taps feel ignored.
Break up long tasks. Any single piece of work over about 50 milliseconds blocks response. Split heavy work into chunks and yield between them.
Ship less JavaScript. The cheapest performance fix remains deleting code. Audit what loads on your slowest page and remove what is not needed there.
Do not block on analytics and third parties. Tag managers, chat widgets, and tracking scripts are a common cause of unresponsive pages. Load them after your own code, and audit them periodically — most sites accumulate scripts nobody can account for.
Give immediate visual feedback. If an action genuinely takes time, show a state change instantly. A button that dims the moment it is pressed feels responsive even while the work continues.
The fixes that move CLS
CLS is the easiest of the three to fix and the most embarrassing to leave broken.
Reserve space for everything that loads late. Images, ads, embeds, banners. Set dimensions or an aspect ratio so the space exists before the content arrives.
Load fonts without a layout jump. Match your fallback font's metrics to your web font so the swap does not reflow text.
Never insert content above existing content after load, unless the user asked for it. The cookie banner that pushes the whole page down is a self-inflicted wound.
Before you commit a sprint to this
Performance work is easy to over-invest in, because the numbers are satisfying to improve and the business impact is indirect.
The honest framing: speed removes friction, it does not create demand. Making a page load faster will not fix a weak offer or absent traffic. But if you already have visitors and they are leaving before the page renders, this is among the highest-return work available to you.
If you are unsure which situation you are in, we are happy to look at your numbers with you and tell you plainly whether Core Web Vitals is your bottleneck or a distraction from one.
How this connects to revenue, honestly
You will find a lot of confident claims about conversion lifts from speed improvements. Treat specific percentages with suspicion — they come from particular sites with particular audiences, and yours is neither.
What is defensible: slow pages lose visitors before they see anything, mobile users on weak connections are the most affected, and page experience is one input among many into search ranking. Faster is better. How much better depends entirely on where you are starting from.
The largest gains go to sites that are currently bad. If your LCP is six seconds, fixing it will be visible in your analytics. If it is 2.4 seconds, chasing 2.1 is probably not where your next sprint belongs.
A sensible order of work
If you are starting from a red report and want the shortest path to green:
- Get field data. Confirm there is a real problem.
- Fix your hero image — format, dimensions, and how early it is discovered.
- Reserve space for anything that loads late, killing most of your CLS.
- Remove or defer the heaviest third-party scripts.
- Split the long tasks that block interaction.
- Re-measure after a few weeks, because field data lags.
Steps two and three typically take a day between them and resolve the majority of failing pages. That is an unusually good return, and it is why we suggest doing them before anything more ambitious.
Keep it from drifting back
Set a performance budget, enforce it in your build so a regression fails the pipeline rather than a review, and watch field data monthly rather than waiting for a report to alarm someone.
Core Web Vitals in 2026 are not a checkbox you clear once. They drift with every feature, every new script, and every marketing tag added in a hurry. A budget that fails loudly is the only thing we have seen keep them healthy over years.
If your site is slow and you would rather have a measured answer than a guess, book a free consultation call or email us at info@playxoft.com. We will tell you what is actually costing you visitors, what it takes to fix, and what we would leave alone.